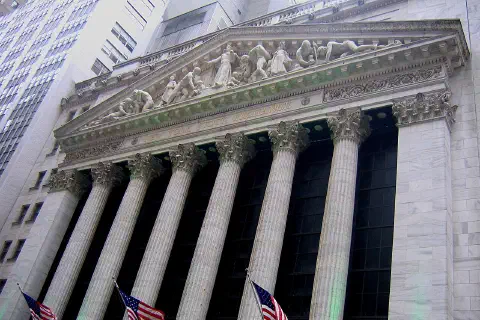
Christmas: Is the Santa rally real?
Wall Street greets the last trading days of December with talk of the 'Santa Claus rally', the statistical habit of shares drifting higher into year-end. The S&P 500 has now risen for nine weeks in a row and goes into the holiday stretch with speculative momentum running flat out. Quantitative analysts know that seasonal patterns make a flimsy basis for putting money to work.
Where the idea came from
The phrase belongs to Yale Hirsch, who coined it in 1972 in the Stock Trader's Almanac, a compendium of calendar patterns. He defined the rally narrowly, as the last five trading days of the year and the first two of the next. On that definition the index has risen in a large majority of years since the 1950s, which is why the idea survives. The average gain in the window is modest, however, small enough to be wiped out by one bad afternoon, and it says nothing about what follows.
This year the story has unusual fuel. The index began the year below 4,000 and now sits within touching distance of the record it set in the first days of 2022. The Dow Jones Industrial Average closed above 37,000 for the first time on 13 December, the day the Federal Reserve signalled that it expected to cut rates next year. Futures markets have since priced something like six quarter-point cuts for next year, well beyond the three the Fed's own officials pencilled in.
Dressing the shop window
Santa has little to do with it. The year-end rise owes more to thin holiday trading and to 'window dressing' by fund managers, who like their client reports to show the big technology winners. Systematic funds covering their shorts add a little more. A rally built on low volume and mechanical buying can turn quickly, and January, when normal trading returns, is when it tends to happen.
Window dressing is well documented. Academic studies of pension-fund managers in the early 1990s found that they tended to sell losing stocks before reporting dates, so that year-end holdings lists looked wiser than the year's trading had been. This year the incentive points in one direction. A handful of giant technology companies, nicknamed the Magnificent Seven, account for most of the index's gain, and a manager who missed them has every reason to buy some before the portfolio snapshot on 29 December.
Thin trading magnifies the effect. With many traders and market-makers away, a given order moves prices further than it would in a busy week, because there are fewer people on the other side. The same small flow of year-end buying that would be absorbed without trace in March can push the index to new highs in the week after Christmas. The price rises, but the evidence it offers about investors' conviction is weak.
Why the statistics are thin
The quantitative case against building a strategy on the pattern is simple. Seven trading days a year over seven decades is a small sample, and daily share returns are noisy, so an average gain of the size usually quoted is hard to distinguish from luck. Analysts who search the calendar for profitable windows will always find some; test enough windows and a few will look significant by chance alone. A pattern discovered by trawling needs to be confirmed on fresh data before anyone trades it.
Calendar anomalies also tend to fade once they are known. The January effect, in which small companies outperformed at the turn of the year, was documented in the 1970s and has weakened considerably since. Its standard explanation was tax: American investors sell losing shares in December to realise losses against their gains, then buy back in January once the 30-day wash-sale rule allows. When a pattern has a mechanical cause, traders learn to front-run it, and the gain migrates earlier or disappears.
When Santa failed to show
Recent history offers two warnings. In December 2018 the S&P 500 fell by about 9 per cent, its worst December since the Depression, as investors fretted about Fed tightening and a trade war, with the sharpest drop on Christmas Eve. More pertinently, a strong run into the end of 2021 was followed by a January 2022 in which the index lost about 5 per cent and the technology-heavy Nasdaq fared worse, as markets woke up to how fast the Fed would raise rates. Hirsch himself treated a missing rally as a warning for the year ahead, which shows how readily a seasonal pattern gets turned into prophecy.
The 2022 case matters because of the cause. A rally built on a view of interest rates is exposed to any data that challenge that view, and year-end trading does not test it. The first full week of January brings the December jobs report, and the December inflation figures follow shortly after. Either could remind the market that the Fed's projections imply half the easing now priced.
What to watch in January
Valuations add to the risk. Most of the year's gain came from higher multiples of expected earnings, not from higher earnings, so the index's level depends heavily on lower bond yields persisting. Companies start reporting fourth-quarter results in mid-January, and guidance for the coming year will show whether profit forecasts can catch up with prices. A rise in the ten-year Treasury yield back above 4 per cent would be the clearest early warning that the rate story is being repriced. Breadth is another tell: a rally led by a few giants is more fragile than one in which most shares take part, and in recent weeks smaller companies have only begun to join in.
The Santa rally is pleasant enough. Investors who treat thin holiday trading as support for stretched valuations are likely to wake up to a painful January once the volume comes back. The more probable pattern is a stall or a modest pullback in the first weeks of the new year, as the jobs and inflation data force markets to scale back their bets on six cuts towards the three the Fed has signalled.
Write to Arnav Goel at contact@thelombardreview.com
The Sunday Edition, in your inbox
India's economy, markets and money every Sunday, plus our analysis twice a week. Free.
Unsubscribe any time. See our Privacy Notice.