Cyber Monday: What the discounts say about inflation
Americans spent an estimated $11.3 billion online on Cyber Monday 2022, according to Adobe Analytics, a record in nominal terms for the annual shopping day. Retailers will put out triumphant press releases. Economists who look beneath the headline will find less to cheer. The figures show heavy discounting, flat volumes and goods prices that have started to fall. Cyber Monday measured how hard online merchants had to work to clear stock before the year closes, and it says little that is good about the health of the consumer.
Any sound analysis starts by separating nominal revenue from real volume. Nominal spending grew by barely five per cent, while consumer prices have risen by nearly eight per cent over the past year, so the quantity of goods sold fell. Shoppers bought fewer items at higher average prices on Cyber Monday, and they did so only because online retailers offered exceptionally deep price cuts.
A season built on markdowns
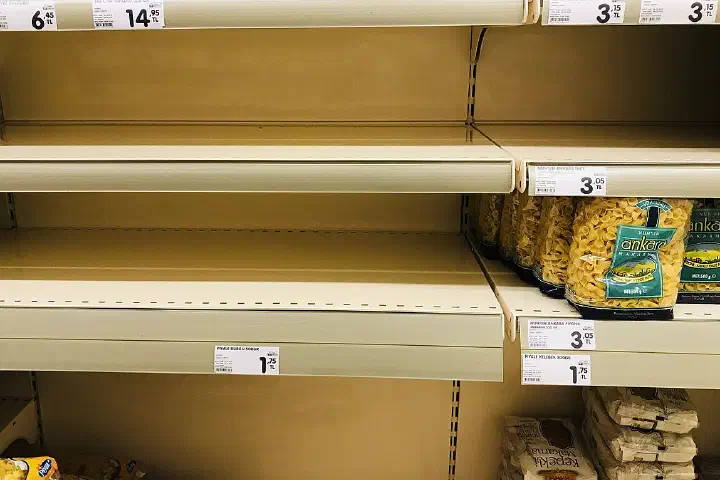
The weekend followed a year in which the largest retailers admitted to ordering far too much. Target, Walmart and others spent the summer and autumn cancelling orders and marking down stock that arrived after demand had shifted to services. By Thanksgiving the problem had moved from their warehouses to their websites, where discounts could be deployed quickly and precisely.
That shapes how the record should be read. A shopping day that sets a nominal record only because prices were cut deeply is evidence of excess supply, not strong demand. Retailers were willing to trade margin for volume because the alternative was carrying unsold goods into a new year with higher storage and financing costs.
Online prices move first
High-frequency online price indices have become the best early guide to the official inflation figures. The Adobe Digital Price Index, for one, tracks more than one hundred million individual products across US retail websites. In 2021 such trackers picked up the rise in goods prices months before the Bureau of Labor Statistics releases did. Over the past three months, however, the same indices have recorded their steepest price falls since the pandemic began.
The idea has a respectable history. The Billion Prices Project, begun at the Massachusetts Institute of Technology, showed that prices scraped from retailers' websites could track official inflation closely and could even expose official statistics that understated it, as in Argentina. The lesson from that work is that online prices are a timely signal for goods, though they say much less about services, which make up most of the core index.

On Cyber Monday discounts in key categories reached record depths. Electronics were marked down by an average of twenty-five per cent, clothing by thirty per cent and computer hardware by nearly eighteen per cent. These cuts go well beyond the usual seasonal promotions. Retailers are working through a huge inventory overhang that has clogged their balance sheets all year, and online pricing algorithms, which react instantly to stock levels and rivals' moves, have pushed prices down hard to shift volume through the checkout.
Next stop, the CPI
The discounting has large implications for the official consumer price index. Physical goods make up nearly forty per cent of the core CPI basket, and they feel the pressure from online price cuts straight away. As online sellers cut prices to clear stock, high-street retailers have to match them or lose market share, and the resulting price cuts will almost certainly show up in the goods categories of the November and December CPI reports.
A technical point matters here. The official figures are seasonally adjusted, and the adjustment already expects prices to dip in late November. A normal holiday discount therefore does nothing to the adjusted index. Only discounts deeper than usual, as this year's appear to be, will pull the published numbers down, and the size of the pull depends on how far the gap between this season and past ones persists into December.
Falling core goods inflation is no longer a forecast. It is happening, and retailers' pricing data record it every second. Core goods prices fell in October's consumer price report. Used cars, electronics, sporting goods and casual clothing are all turning from sources of inflation into drags on the headline figure. The supply pressures that pushed prices up in 2021 have run their course, and an inventory glut is now pulling them down.
Why services still decide
The strongest objection is that goods were never the whole problem. Services such as rent, insurance, medical care and restaurant meals make up the larger share of core inflation, and they are driven by wages, not inventories. A fall in goods prices can bring headline inflation down quickly, but it cannot on its own return core inflation to the Federal Reserve's 2 per cent target while wages grow at their current pace.
Discounting can also reverse. Retailers that clear their shelves this season will order more cautiously for next year, and once stocks are lean they will have less reason to cut prices. The goods deflation now under way is a correction of an overshoot, and it will fade once the overshoot is gone. Chairman Jerome Powell's speech on the outlook this week, and the Fed's projections at its December meeting, will show how much weight officials put on it.
The Cyber Monday record is probably the last gasp of the pandemic boom in goods. Retailers needed deep discounts to pry eleven billion dollars out of shoppers, a sign that goods prices are now falling and that pricing power has passed from merchants back to cash-strapped customers. Cheaper goods will give the Federal Reserve cover to slow its rate rises in December, but squeezed margins mean equity investors should brace for earnings downgrades through 2023, with discretionary retailers and the consumer-electronics makers that supply them hit first in their results for the holiday quarter.
Write to Arnav Goel at contact@thelombardreview.com
The Sunday Edition, in your inbox
India's economy, markets and money every Sunday, plus our analysis twice a week. Free.
Unsubscribe any time. See our Privacy Notice.


